Mapping Schools and Libraries in Queens, NYC
Queens Public Library
Innovation Synopsis
In late 2024, Queens Public Library launched a five-year strategic plan, part of which calls for strengthening youth engagement and its role in the community. Queens has over 1,500 public and private schools, colleges/universities and 66 library locations across nearly 109 square miles.
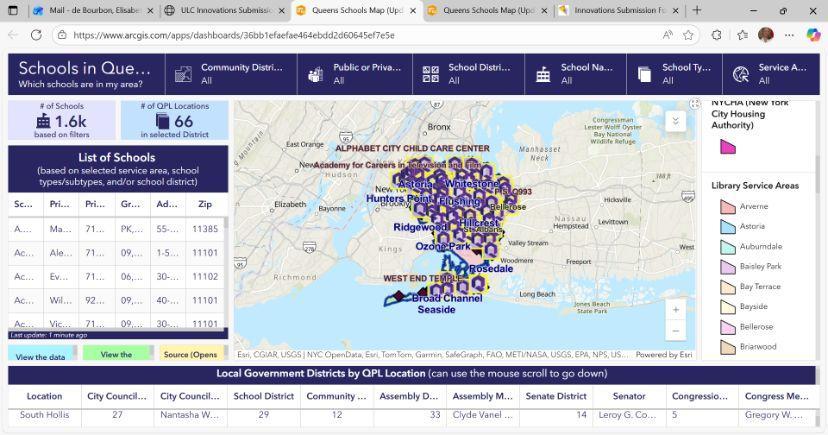
To meet this goal, the Library needed to first establish the location of schools in relation to our library sites. We created an interactive map dashboard, integrating raw data from multiple sources to centralize key information about all schools in Queens within a single, easy-to-navigate platform. This new tool helps to inform program planning, outreach targets, grant and stakeholder reporting, and strategies for developing partnerships with schools.
Challenge/Opportunity
To support strategic planning and outreach, we developed an easy-to-use dashboard that centralizes key school data across Queens. This tool enables staff to make informed decisions, prioritize partnerships, and allocate resources effectively. Its interactive features allow users to filter by geography, school type, and grade level, enhancing both planning and collaboration. By visualizing school distribution relative to library branches, the dashboard reveals service gaps and supports equity-focused initiatives. Ultimately, it streamlines workflows, improves communication, and saves time by eliminating the need to gather data from multiple sources.
Key Elements of Innovation
This dashboard highlights Queens Public Library’s innovative use of data and mapping to streamline planning and decision-making. By integrating multiple data sources, it reduces time spent gathering school information and supports data-informed outreach. Staff can visualize schools by service area, assess proximity, and identify where to focus partnerships and resources. Features include school type, grade levels, principal contact info (NYCPS), library service areas, and political boundaries. It answers key questions like: What schools are nearby? Which district is my branch in? Who are the elected officials in my area?
Achieved Outcomes
QPL’s Schools Dashboard has supported staff in promoting and planning programs, strengthening school partnerships, and retrieving key information for stakeholders and grant funders. While outcomes have not yet been formally quantified, the dashboard has already shown promise in advancing QPL’s strategic goals to increase engagement with families, children, and young adults across Queens.
As QPL’s new Strategic Plan moves forward, we aim to better measure its impact on program delivery, partnerships, and youth engagement within QPL's service areas.
Sample use cases shared by staff:
Identified nearby middle schools for two QPL branches to promote Peer-to-Peer Intro to Coding workshops, resulting in an average of 12 attendees per session.
Streamlined the process for locating schools and key contacts to strengthen school partnerships.
Informed the selection of audiences for grant-funded reading materials based on the characteristics of nearby schools.