Data Visualization for Collection Development
Prince George's County Memorial Library System, Md.
Innovation Synopsis
Using the data visualization tool Tableau, Prince George's County Memorial Library System implemented more effective collection assessment processes by engaging staff to build a stronger customer-focused collection that is shown by rising circulation and positive customer feedback.
Challenge/Opportunity
- Making sense of the data provided by the integrated library system (ILS), Polaris, in order to make informed purchasing decisions
- Meeting specific community needs in highly disparate demographics throughout a geographically large county
- Learning new ways to make the best use of our materials budget
- Having a more engaged staff to provide better feedback on use of their collections
Key Elements of Innovation
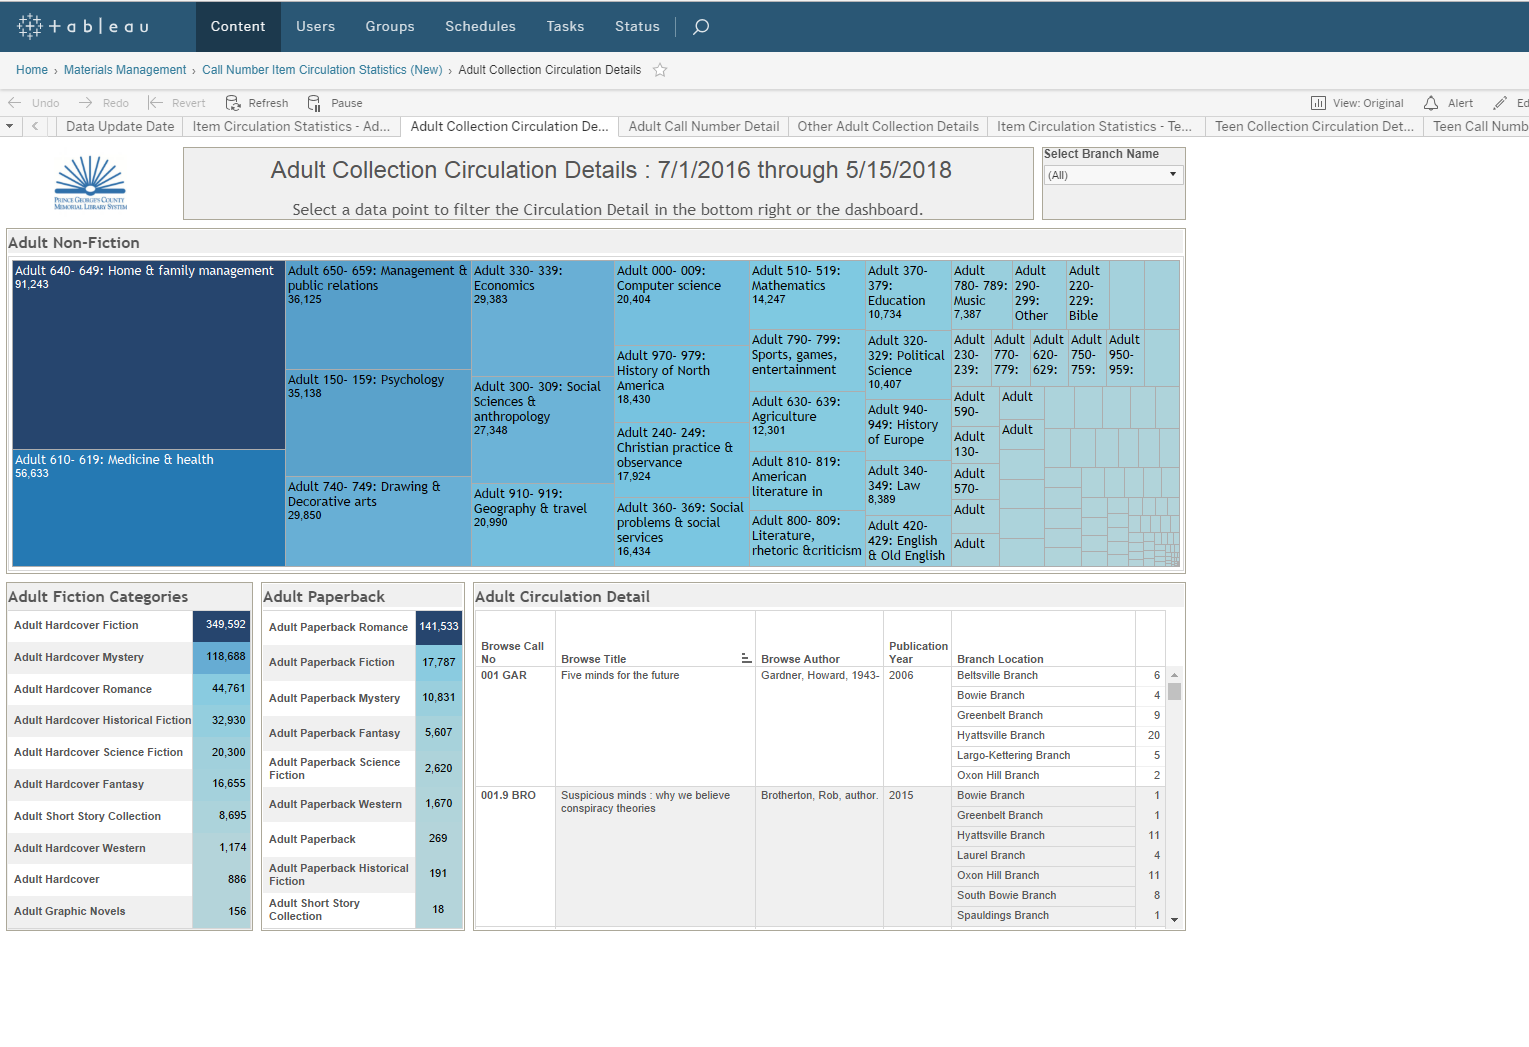
Engaged business intelligence and analytics consultant, icimo, to develop dashboards and strategies using Tableau. Weekly conference calls to share ideas and critique in order to pinpoint exact needs. Getting an outsider's perspective on library data allowed for innovative approaches to report creation. Hands-on training and mentoring of all staff in Tableau in order to give them ownership of the process and the data.
Achieved Outcomes
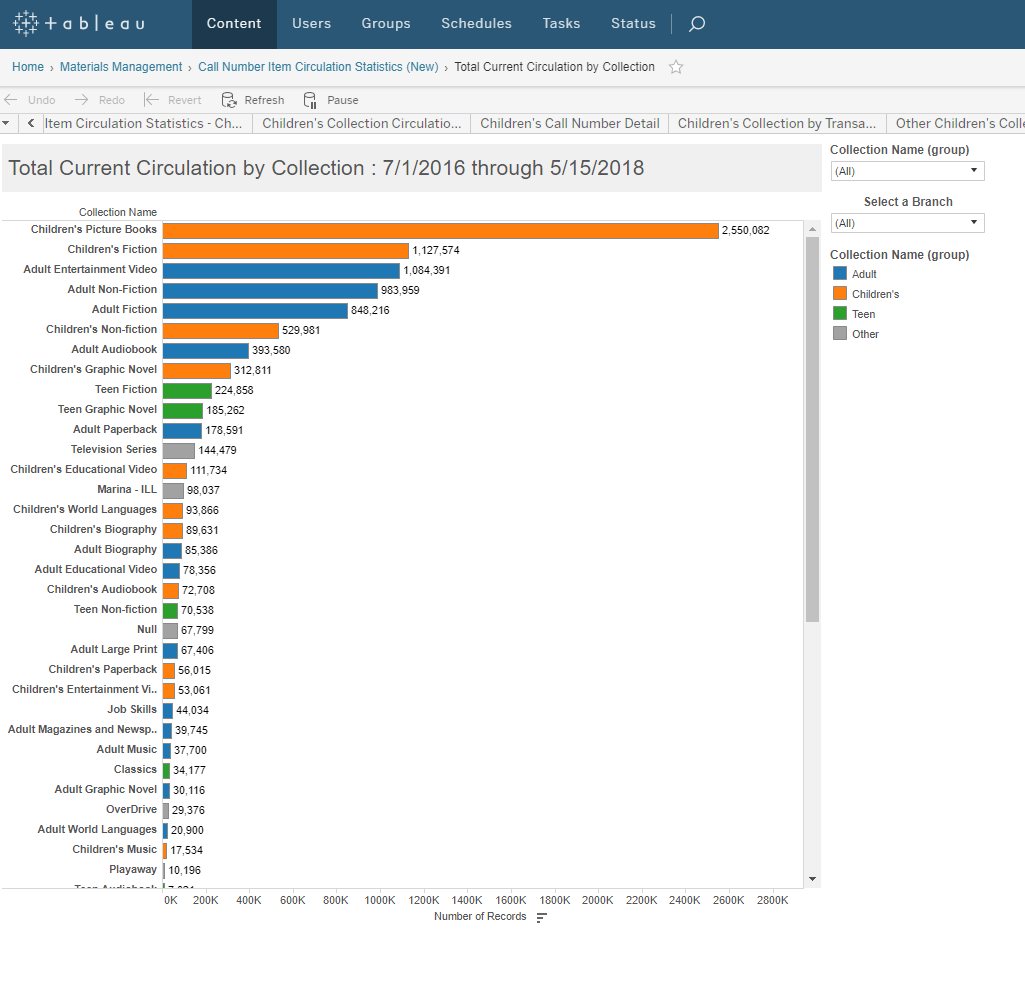
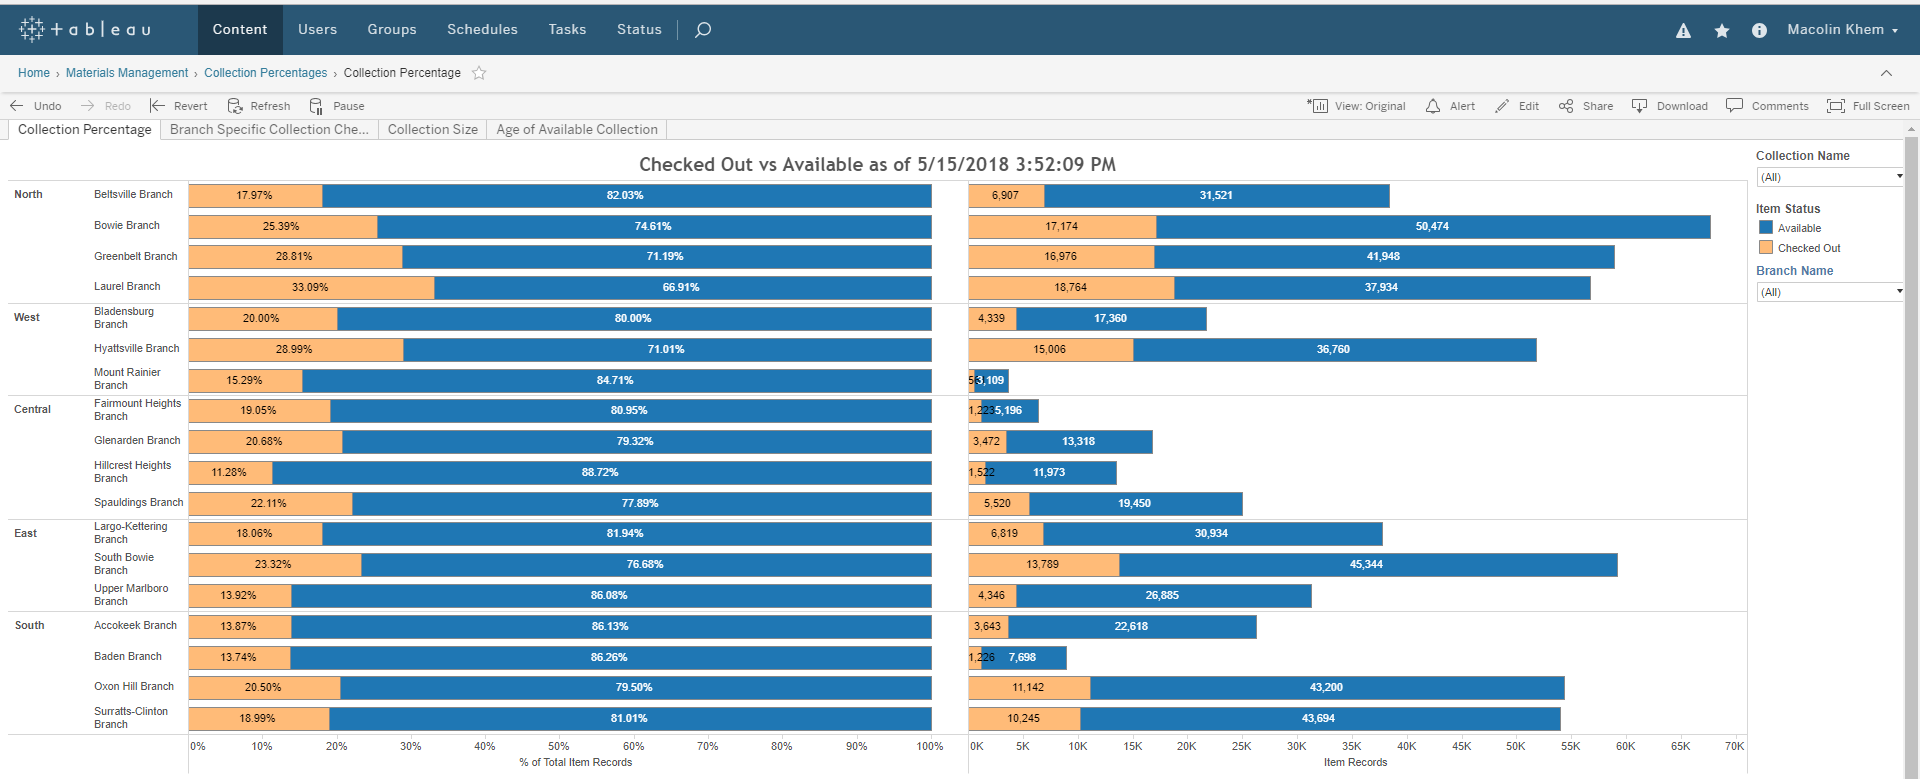
Giving staff access allowed them to gain insight into how PGCMLS' collection is used both at a branch and system level. This encouraged better management of collections, such as conceptualizing weeding as a positive, leading to the success of the new collection assessment program. This met the library's strategic plan initiative for early literacy - showing that by far children's materials circulate the highest in our system - and technology access goals by providing needed electronic resources.